Without doing anything special, you are already using your history by just entering sets in the training screen. Because previous sets are shown there, you know about past performances of an exercise at first glance.
But there are more ways to view your history:
- Sets of an exercise in the training screen
- Sets of a session in the session view
- Session list in the history tab
- Sessions of a month in the calendar view
Session Summary
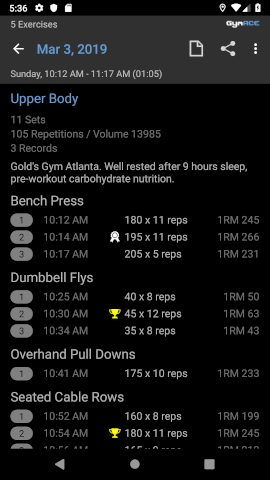
The session summary shows you all the sets you performed during a session. They are arranged chronologically and grouped by exercises. If you add another set of the first exercise at the end of the session, that set will be listed under the first exercise, not at the end of the list. Since each set is displayed along with its timestamp, you can easily see this.
In this view, you can also add a note for the entire session as well as share a session report. For example, send by e-mail or WhatsApp.
It also displays information about the total number of repetitions, the workload, and the number of any new records. Depending on the training goal you can thus classify yourself how good the session was.
Workload
Whereas the one-repetition maximum (1RM) is a measure of the force, the workload is a measure of the training volume. A higher volume does not mean that you have become stronger. A larger 1RM does not mean you've done more work. Simply put, 1RM means quality, workload means quantity. For success in strength training both factors are essential.
The formula for the workload is very simple. It is the sum of weight x repetition for each set. That is, if you perform 3 sets of 200 lbs. x 10 reps, the volume is 3 * 200 * 10 or 6000. Of course, this is only an approximation. An absolutely realistic measure of the work according to the laws of physics would have to take into account the distances and force patterns of each repetition.
What's the use? It's a quick and easy way to compare workouts. Look at the session summary and see how it differs from previous sessions. All the hard work will sooner or later be reflected in the numbers. Consider it as an incentive to continue. And if your performance stagnates over a long period of time, you know it's time to change something in the training routine.
Some training programs suggest switching between high and low volume workouts to create variety. Low-volume workouts would mean a higher weight at lower reps, and high-volume workouts would be the opposite. The monitoring of the workload is also ideally suited to recognize and prevent a possible overtraining.
The Calendar View
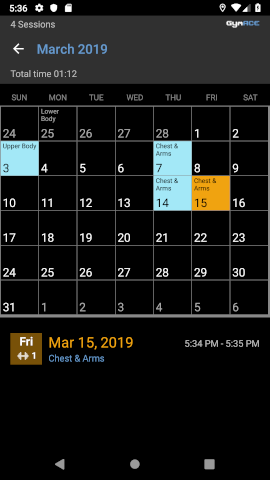
The calendar gives you a quick visual overview of your workout history. You open it either from the Home screen or the History menu and the calendar icon in the upper right corner.
It shows how often and how long you've been training in a month. You can scroll to the left or right from one month to another by swiping. Tap on any day in the calendar field to list the session(s) of the day (this can be several). Tap on a session to open the session summary.
The Graph View
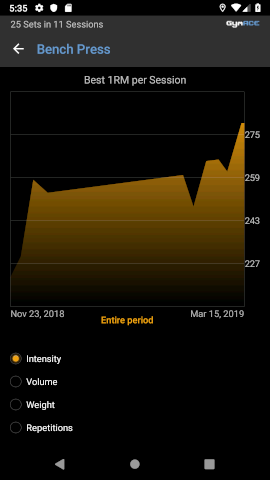
You will often work with the graph view, so it is easily accessible directly from the training screen. Touch the graph icon in the bottom bar.
By default, the intensity graph is selected. For each session, the best 1 repetition maximum (or the highest number of repetitions in bodyweight exercises) is displayed. Sometimes the first set is your best set, sometimes your last set, depending on your training strategy. By graphing the best set per training session, GymACE offers the optimal overall impression of your workout.
You can also select a volume graph (see Workload), a weight graph (highest weight of a session), and a repetition graph (maximum repetitions of a session).
The workload increases with each repetition (and each weight) of each set. It is a measure of "how much" you perform. In terms of intensity, the set with the highest effort that you've fought the most counts for. It's a measure of how "hard" you are capable of exercising, which ultimately drives muscle growth. Often, however, you also need a higher volume to progress.
The chart supports pinch and pan gestures for zooming and moving or changing the start and end dates. You can also tap directly on data points to see details.